Saturday, January 16, 2010

More on Chung Testing

It's been impossible to do much testing in the past two months due to weather.  I can't get out there in a skinsuit if the temp is below 55 degrees - it's just too uncomfortable.  And any breeze at all invalidates the data; so that eliminates lots of days.

But yesterday I was able to get another set of data collected on my P2K.  So now I have three data sets with the same setup.  My CdA results from three different days on the same test course are 0.228, 0.230, and 0.235.  Based on n=3, my average CdA is 0.231 and the standard deviation is 0.0036.  These numbers reflect skinsuit, TT helmet, shoe covers, no gloves, Zipp 303 front wheel, and power tap with Kinlin XR-300 (30mm) rear wheel.

My Cervelo P2K frame was slightly damaged in a crash last year, so I'm about to move my P2K components over to a Cervelo P3 frame a teammate recently gave me.  I'll set it up exactly the same as my P2K, except I'll run a Zipp 404 on the front instead of a Zipp 303.  The only difference between the new test setup and race setup will be the absence of my disc wheel during testing.

These aren't my bikes, but depict my old P2K frame and new P3 frame:


I'll be interested to see how much difference the frame change and 303 vs 404 change make to my CdA.

Sunday, January 04, 2009

Five Pain Portraits

I've recently administered FTP tests for a few other riders - 45 minutes - as hard as you can go and still finish the test. All of them were strong and experienced racers. But as you can see from the charts below, none of them had the same approach to the test. It was fun, and sometimes very painful, to watch.

This guy started too easy and probably had too much left at the end:


This guy started too hard and struggled at the finish:


This guy's approach took him to all sorts of highs and lows. A premature finishing push and subsequent burnout probably cost him a few watts:


This guy had good, if slightly undulating, pacing and turned himself inside out, in and out of the saddle, to maintain his number in the closing minutes:


This guy's metronomic output was juuuuusst right (guess who's the experiened time trial specialist of the group?). Amazing consistency and near-perfect pacing.


I expect higher numbers from the first three riders if they choose to test again later in the season - from better pacing strategy if not also from improved fitness. If the last two want higher numbers, they'd better just "Ride Lots."

Tuesday, November 04, 2008

FTP Paradigm Shift

Three weeks ago I had a very poor time trial result in Ringgold. I felt mentally with it and well-motivated during the race, but in reflection I realized that I never exhibited the 'symptoms' that I normally do in an all-out TT effort. In a good TT, a couple of strange things normally happen to me:


1-At least once or twice during the effort, I convince myself that I've ramped up the power too hard, totally screwed up my pacing, and honestly question if I'll be able to finish the course. I can remember sorting through false excuses in my mind to explain to my teammates why I didn't show up at the finish line ("I got tired" doesn't sound too hot). It's never happened, and I know it sounds ridiculous, but it's absolutely true. Your mind can play tricks on you in a hard TT.


2 - At least a couple of times during the effort, I involuntarily cuss, shout, talk, or whatever. It's like I've contracted Tourettes Syndrome and have no control of my speech. It's really very strange. I've startled a few volunteers by doing it.


Neither of those things happened in Ringgold. I think that means I didn't leave it all out there. I'm not sure why that happened - end of a long, hard season, I guess. Come to think of it, neither of those things has happened in my TTTs, either. I wonder if that's because I'm not giving it everything or because I have rest intervals?


The day after the Ringgold TT, I did a FTP test on the Computrainer. Near the beginning of the test, my computer monitor went out. It got so fuzzy that I couldn't read the wattage on the screen. I continued working hard and completed the test. I was expecting a good result, but when I downloaded the data I found that my FTP was only 264 watts. I had expected it to be around 280, at least. I was disappointed in the result, but in a way I was relieved. I figured it had been a long year and it was normal for me not to be able to maintain my FTP from January to October, and that's why I performed poorly in Ringgold. It all seemed to fit, and it gave me an easy out. I looked forward to starting a new FTP ramp in November.


But yesterday, November 3rd, I performed another FTP test. This time I had a new monitor and could use the average wattage number as a carrott during the test. Guess what? My FTP is 286 watts!


All of this shifts my training paradigm and convinces me of three things. First, the Ringgold thing was a failure of my mind, not my legs. Second, I have to get an Ergomo BB for my TT bike before February to give me a carrott and maximize my power output. And third, I'm starting my FTP ramp for 2009 about 2 watts higher than the end of my 2008 FTP ramp.


Can I gain 20 watts in 14 weeks this winter like I did last winter? I have no idea. Either I'll have lots of work with no improvement this winter, or I'll move to a 300-watt FTP, 4.6 watts/kg. Most likely it'll be something in between.


Monday, January 21, 2008

FTP update

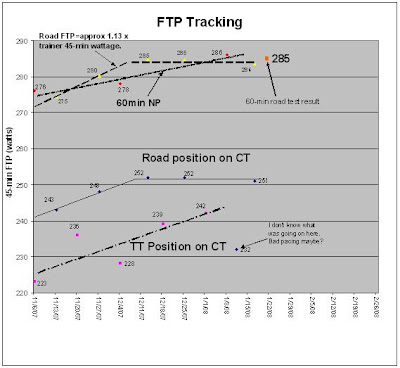
I finally did a 60-min FTP effort -- below is the updated FTP chart. As it turns out, the best way for me to predict my FTP without actually doing a 60-min TT effort is with 60-min NP. I guess that's close to proof that Coggan's normalized power formula works extremely well (for me at least). I can also use 45-min computrainer x 1.13.

The crappy part is that I had to go back to December 11th and update my FTP in WKO. That knocked my CTL down about 3 points.

Wednesday, December 19, 2007

FTP Improvement

The plan is working..... but can I maintain the progress? We'll see.


(From empirical evidence, I know that my road FTP is 106% of my 45min power on the Computrainer).

Monday, December 10, 2007

Winter L4 work on TT bike - yes or no?

I'm of the opinion that alternating from road bike to TT bike for my weekly 45-min power test is a good way to improve my power on the TT bike for spring. And even if my power is slightly lower in TT position, I think I still get great benefit from a physiological perspective.

A few contributors to Google Wattage and a friend of mine have very different opinions. They say that I'm wasting my time by riding the TT bike in December when I should be using every valuable minute of L4 winter training to increase road bike FTP. They say I should be on my road bike for every L4 workout until February.

I think I'm going to be stubborn and continue to do every other week in TT position because I think the benefits outweigh the costs. If you have an opinion, enter it into the poll on the upper right corner of the blog.

Wednesday, December 05, 2007

Agony, Agony, Agony

Some days you just don't have it. I suffered through my 45-min test in TT position on the Cervelo last night. I never felt comfortable, constantly looking for the right cadence and getting weaker as I went. The experience was quite unpleasant. It sucked - 228 watts (that corresponds to a FTP of 242 watts for my aggresive TT position (for a variety of reasons I can generate about 6% more power on the road). Maybe next time will be better.

Tuesday, November 27, 2007

The Power-Equipment-Speed Relationships

I spend and awful lot of time and energy measuring my power on the bike. But power doesn't win races, speed does. For the foreseeable future, power will be the best way to track changes in fitness; and it will be the best method of structuring a training program.

But in order to step back and see the big picture or to run through various equipment scenarios, I think it's important to know:

  1. how much faster will I be on a flat TT if I increase my FTP by 20 watts, or

  2. how much time will I cut off a climb if I lose 5 pounds, or

  3. how much time will I cut off a climb if I buy a bike that's 2 pounds lighter, or

  4. how much energy (power) will I save sitting in a 25-mph paceline if I swap my Ksyriums for Zipp 404s, or

  5. if I do a solo break away with one lap to go on the rolling Augusta road race course would I go faster with my lighter box section rims or heavier but more aero deep section rims, or

  6. what will the winning gap be if I sprint with 800 watts over 150 meters against a 180-pound guy putting out 970 watts? And more importantly, who will win? And if it's not me, how many more watts do I need to win?

There are many variables involved in answering those questions, but almost all of them are measurable to a fairly high degree if you have the time, equipment, patience, and desire. I've already answered many of them for myself, but I've used different spreadsheets or methods or web sites for almost every question and situation. And those spreadsheets, methods, or web sites often make assumptions that I don't agree with or simplifications that don't apply to what I'm doing. So it's hard to be consistent across the board with answering the questions and be confident in the answers.

So I decided to create a spreadsheet that ties all the physics together to the best of my abilities. I'm well aware that I'm probably the 10,000th person to attempt this task and that it's been done by folks with a lot more knowledge that I have. My spreadsheet might be better than some and will not be as good as others you might have seen. I hope it is accurate from a physics and math standpoint, but I'm not 100% sure. If you find errors, please let me know so I can make corrections and minimize the embarrassment factor.

But if nothing else, going through the tedious process has helped me understand the physics behind the above questions better than I did before, and that's reason enough to do it.

I've named the spreadsheet Badger because all the other names I thought of were about a mile long and sounded like the title of someone's masters thesis. This is bike racing, not study hall. It's a work in progress, but if you assume a rolling resistance coefficient, you can calculate almost anything else (use Crr=0.005 if you aren't sure. There are field tests to measure Crr, and I'll work on those later).

My spreadsheet is available here: Badger

In a nut shell, this is how it works:

  • The first sheet, "CdA calc", uses your input data (weight, weather data, distance, time, slope, and assumed rolling resistance) to calculate the forces against the rider (rolling resistance, air resistance, and slope resistance). Start and finish speeds should be entered so momentum can be accounted for, but results are best when start and finish speeds are equal. All the forces against the rider are set equal to the wattage you put out (to satisfy conservation of energy), and the equation is set up to solve for your drag coefficient CdA. For coast down tests, use wattage equal 0.
  • On the second sheet, input your weight, weather data, and the CdA that you calculated from the first sheet (you have to manipulate Cd and A to get the right CdA). Use 0.40 for A if you aren't sure - as long as CdA is correct it really doesn't matter). Assume a rolling resistance coefficient (Crr). Then you can set up each segment of any course to see how changing variables such as wattage, weight, rolling resistance, and CdA will change your finish time for the entire course. If the totals on the left side of the spreadsheet show errors, just delete any cells on the right side of the spreadsheet that aren't being used and that should solve the problem.

Wednesday, November 14, 2007

Orbea FTP Test

Last Tuesday was a 45-min FTP test on the Cervelo in TT position on the computrainer -- average 251 watts.

This Tuesday was a 45-min FTP test on the Orbea in road position on the computrainer -- average 274 watts.

That's a 9% difference and realistically probably 10% becasue I was fresher for the TT ride. That's about the difference that I expected between the two bikes/positions. The Orbea ride was also paced much better and I felt much more powerful throughout the test. It wouldn't surprise me if my TT ride wattage next Tuesday is higher due to better pacing alone.

The unexpected part of the whole deal was finding out that my computrainer wattage is 10% higher than the wattage measured by my Ergomo (mounted on my Orbea). I'm confident that my Ergomo is accurate, and this confirms a 10% difference between the two that I found last week when testing a teammate. I thought maybe his left leg was weaker due to a prior injury (which would result in an Ergomo/CT discrepancy), but I guess not. You'd expect the computrainer number to be a little less than the Ergomo number (maybe 2-4%) because of drivetrain losses between the crank and the road, but not 10% different.

All of my Tuesday night FTP tests will be on the computrainer but not always with the Ergomo, so I'll use CT numbers in my winter-training tracking charts. Measuring change is the important part, not measuring accurate wattage. Plus using the CT numbers will make me look stronger than I actually am, which is always a bonus!

Bottom line: My road FTP is about 265 now. Hopefully when I test in early January it will be at least 280.

Wednesday, November 07, 2007

Cervelo FTP test

My winter training season officially kicked off this week, and Tuesday is my FTP test day. I plan to alternate each Tuesday between my Cervelo P2K and my Orbea Orca. (winter plan is posted at http://jasperga.blogspot.com/2007/09/new-2008-training-schedule.html) Two reasons to alternate: 1. I'll get good L4 workouts in TT position and road position and 2. I'll find out how much power I sacrifice in the TT position.

Last night's FTP test was 45 mintues long. I started out much too hard, although I didn't realize it at the time. My first 20 minutes average was 265 watts, but my total test average was 251 watts.

I'm not sure exactly how to interpret the numbers. This summer I developed a theory that 20-minute ave power on a computrainer is equal to FTP (for more infor on that theory, see http://jasperga.blogspot.com/2007/06/ftp-testing-and-hammerhead-sharks.html). So the 265 watt 20-minute average is what I would expect this time of year on my Orbea. The 251 watt 45-minute average should be multiplied by probably 1.03 to account for trainer vs. race motivation factor, which would give me 258w for FTP. That seems about right for TT position. I hope to find that my road bike FTP is 10-20 watts higher than my TT bike FTP.

It'll be interesting to see what the Orbea numbers look like next Tuesday. Maybe with better pacing I can yeild a FTP in the 275 range with the Orca. If so, then my February target FTP might be in the 290 to 295 watt range (4.4 watts/kg). That would be a very good platform from which to begin higher intensity training for 2008.

Friday, August 24, 2007

September Sprints

My racing season is over, so I've planned an experiment for the last 6 weeks before my October break: sprint training.

I rarely do sprint intervals -- partly becasuse I can't sprint, so I figure why worry -- and partly becasue they can be rather painful. But in looking at my 2006 data, I've noticed that even without any anaerobic-specific training work (except for what I get accidentally on Tuesday nights and in races) my maximum 5-second wattage has climbed from about 810 watts in 2006 to about 1000 watts in 2007. Maybe more importantly for practical application in racing, my maximum 10-second wattage has jumped from the mid 800s to 930 watts in the past couple of months.

Although I'll never be considered a sprinter, I want to find out how 6 weeks of sprint-specific training will affect my 5-second, 10-second, and 15-second maximal wattages. If I see a significant improvement by the end of September, I'll make sure to include sprint intervals in my training next spring. If my numbers don't move much, I'll leave out the sprint intervals next year and spend that time on hill repeats and TT threshold intervals.

Thursday, August 16, 2007

Happy Talk meets the TT course

Ok, my last post was a bunch of happy talk about how I was so much more aero since I'd improved my position, et cetera, et cetera, et cetera. Numbers are interesting, but the subtitle of this blog is 'Notes on my attempt to ride a bike faster,' not 'Notes on my attempt to prove mathematically that I have a better aero factor.'

So -- today I did a time trial.

A little background:
I started training for races in April '06. For the first 6 months, I didn't own a power meter, but I wanted to track my training progress. So I established a little 6-mile out-and-back hilly time trial and ran it hard every few weeks. In early '06 my times were in the 17:30 range. I made a May goal to do the TT course in 16 minutes by the end of the season (September 2006). I worked hard, but the best time I could muster in '06 was 16:29 (21.4 mph). I was sort of ill with myself for setting an unrealistic goal - in retrospect, I thought, 60 seconds improvement on a 6-mile course was not realistic.

This year I have a power meter, so I didn't need the TT course to monitor my form. Also, my favorite races, Rome, Dahlonega, and Augusta would have a TTT, an uphill TT, and a 2-mile prologue, so I didn't work on my time trialing much this year. In May, when I thought my form was good and I'd go out and crush my pitiful '06 TT efforts, I ran my TT course and turned in a 16:45. Damn - 15 seconds off last year's best. I pretty much stopped using the course after that.

I tried the course again today. I knew I was more aero, but I was skeptical that I could maintain adequate power in my new TT position to go very much faster, particularly on a short, hilly track like my test course.

Well it turns out that I'm faster -- a LOT faster. I did the course in 15:29 (22.9 mph) in a slight breeze. That's a minute over last year's best, which was run when I was fresh - I'm not even fresh this week. That gives me real world proof that all my efforts are paying off and I'm getting faster.

Am I faster because I'm more powerful or am I faster because I'm more aero - probably both, but who cares - I'm faster, that's all that matters.

I'm now eager to work hard this winter in my new TT position and kill my personal best time in the Tundra Time Trial on the Silver Comet in February.

Wednesday, July 04, 2007

Poor man's wind tunnel

I wanted to know what effect my TT bike, Aero helmet, and skinsuit had on my drag coefficients and TT finish times, but didn't want to pay $2500 for a couple of hours in a wind tunnel. So I found the longest fairly low-traffic hill near my house, a 0.6-mile climb with a 3.5% average grade. Starting at a constant 20mph at the top to eliminate momentum factors, I coasted down the hill lots of times with different aero setups to determine my drag coefficients. I know that my power was 0 watts, so I was able to eliminate power measurement from the list of uncertainties. My typical average speed was in the 23mph range, so I know my numbers will be valid for my average TT speeds.

The only factor pushing me down the hill was gravity, so weight was important. I carefully weighed myself in my kit/shoes/helmet and the bikes prior to testing.

I ran at least 3 'no-car' runs for each setup and averaged them. (I found that each car that passed me during the tests cut about 1 second from my finish time, so I threw out all the runs where cars passed me during the test). There was little or no breeze, it was 88 degrees, and I alternated test runs with various equipment in case the environmental conditions changed during the testing.

The spreadsheet I used required entry of a drag coefficient and/or a bike and rider frontal area and factored those with an air density number to get an 'A2' factor that it used in the calculation. I got everything to work well in the spreadsheet, but I still don't know exactly what my frontal area and drag coefficient are, but I'll work on that later. I used a rolling resistance of 0.004 (which I realize now might be too low for my tubular tires - it's probably nearer .0055).

Here are my averaged results for each setup:
Orbea Orca with standard team kit and helmet, riding in drops - 1:34.5
Cervelo P2K with standard team kit and standard helmet, in aerobars - 1:30.0
Cervelo P2K with standard team kit and TT helmet, in aerobars - 1:29.3
Cervelo P2K with skinsuit and TT helmet, in aerobars - 1:25.8

I was pleased to find that even my low-tech testing was able to accurately measure the effect of even changing helmets on a minute and a half section. The repeatability of the runs was very good, usually within 1 second.

The biggest surprise was the skinsuit. Changing from the team kit to the skinsuit has as much effect at going from the road bike to the tri bike! And the numbers are huge. For a 40K TT, the skinsuit would save 1 minute, 46 seconds. That's a lot of time. Based on my time in the recent half iron man, I saved 4 minutes and 18 seconds purely by wearing the skinsuit and TT helmet. For the short 10-12 mile TTs usually included in the Georgia Cup races, I'll save almost a minute by wearing the skinsuit -- that's amazing to me.

And these numbers are not wild guesses, they are real world measurements that can be easily and accurately extrapolated to racing.

Don't stop training hard -- the bike won't power itself. But for God's sake, buy a skin suit if you're going to ride TTs.

Next I plan to play around with my bar height, bar angle, etc. to see if I can get any measurable effect. And rolling resistance is also on the list of things to investigate.

Since originally posting this earlier in the year, I've fine tuned my analysis spreadsheet. You can view or download it at Badger 3 if you are interested.

Friday, June 29, 2007

FTP Testing and Hammerhead Sharks

Accurate functional threshold power (FTP) testing can be a little tricky. It's rare that you'll get to measure the real number directly -- that can only happen when riding a 1-hour TT effort in competition on a bike with a power meter (my TT bike has none). But you need an accurate number because you use it to set up all of your interval training power ranges. Therefore, you have to use other methods to test for and calculate your FTP.
__________________________________________________________

Analysis paralysis warning: If you're not really, really interested in FTP, save yourself the pain, stop reading here, and just check out my birthday present from Betty Jean instead. I think I'll call him Clayton -- Jeff seems to enjoy hammering as much as anyone I know.


___________________________________________________________

Ok, back to the numbers. In converting other testing numbers into an accurate FTP value, you have to consider the racing vs. training factor and also, if using a trainer for testing, a factor for converting your max effort on a trainer to your potential effort on the road. And finally, it's hard to do 1 hour all-out tests. I do three a year. Between those tests, I keep track of FTP by doing 20-minute efforts and using factors as described below. So you have the 20m to 60m conversion factor too.

I ran a 20-minute test last night on the Computrainer to try and establish the wattage relationship between a 20-min computrainer (CT) test and a 20-min test on the road. I started out way, way, too hard, but leveled out eventually and ended up with average 20-min wattage of 268, which is exactly what my last hour-long road FTP test calculated as my FTP. It’s also exactly 95% of my peak 20-min wattage in the Edgar Soto TT a few weeks ago. Also, it’s interesting to note that the CT gave me the exact same average wattage as did my Ergomo, so they matched perfectly.

So there are a couple of things going on here. First, I’ve become very confident that the relationship between 20-minute average wattage and 60-min (FTP) wattage is 0.95. I have multiple tests showing that my maximum 20-minute power output in races is 95% of my calculated FTP. So I’m holding fast to that relationship. I’m also pretty confident in the training-to-racing 103% relationship (adrenaline/motivation in races allows you to generate about 3% higher wattage over 1hr than in training) is accurate. What I have now is a new relationship between CT testing and road testing in training.

So here are some conversions. First, my designations are:
road = training on the road
CT = training on the Computrainer
race = data from a race

FTP has always been defined as 1 hour race average power:
FTP = 1.00 x (60m – race)

In a 1hr training road test, we increase measured power by 3% to account for adrenaline, motivation, et cetera:
FTP = 1.03 x (60m – road)

A 20-minute race TT gives you 5% higher average power than your 60-min race power, so:
FTP = 0.95 x (20m – race)

For a 20-minute non-race test on the road, we have to throw in both the 95% conversion from 60m to 20m and the training/racing adrenaline factor:
FTP = 0.95 x 1.03 x (20m – road) = 0.98 (20m – road)

Ok, here is the new stuff that I've just figured out:
For whatever reason, I’ve found that power output on the Computrainer is about 2% less than non-racing testing on the road for an extended effort (probably due to heat, lack of breeze, inability to move around, mental factors). So we need to account for that extra 2% with a third factor of 1.02, so:
FTP = 0.95 x 1.03 x 1.02 (20m – CT) = 1.00 (20m CT)

So when all is said and done and you get rid of all the numbers, you end up with a very simple relationship for testing FTP:
FTP is your average 20m power on a CT. That's without a doubt the easiest, most consistent way to test.

Wednesday, May 23, 2007

Ergomo Accuracy Check

Since I deal with wattage numbers a lot, I thought I'd use some numbers from a recent ride to check my Ergomo Pro's accuracy. I have no reason to doubt the numbers it's giving me, but a good real world check now and then makes sense.

The best way to calculate wattage is using data from a climb because air resistance becomes almost negligible at low speeds. Since air resistance is the most difficult to accurately measure (using friction factors and frontal area estimates), the smaller role that it plays, the more confidence I have in the calculation.

I used a wattage calculation spreadsheet to input bike weight, body weight, climb length, climb slope, air temperature, air friction factor, tire rolling resistance, drivetrain friction, rider frontal area, and power output (I entered the average power reading from the climb as measured by my Ergomo Pro).

I was amazed to find that the spreadsheet calculation for climb time matched my actual climb time (as recorded by my Ergomo) to the exact second -- 1 minute, 5 seconds. Later I performed the same calculation for one other climb on the same ride and it matched the calculation by 1 second. That satisfies me that my power meter is giving me good data.

Wednesday, May 16, 2007

Pedal force & muscle fatigue

Past testing has shown me that I achieve my highest power for a constant heart rate (150 bpm) at 65 rpm. My power is significantly higher at that cadence than at 55 rpm or 75 rpm. That's a lot lower (about 20 rpm lower) than my normal cadence. I've more or less ignored the heart rate/cadence data due to two assumptions that I've held:

1. The goal is not to achieve the lowest heart rate, it's to put out the maximum wattage.
2. The higher muscle force required to hold the lower cadence at a given wattage would result in power fade on longer rides more than would a higher cadence with lower muscle force.

This past week's experiments with higher pedal force (a low-cadence hill repeat session last week and last night's group ride) revealed an interesting new wrinkle: My perceived exertion is significantly less when climbing at high power and low cadence than it has been with higher cadence. I guess that's to be expected because the higher cadence climbing is putting a larger share of the physiological load on oxygen transfer (aerobic system). The higher force, lower cadence approach is much more anaerobic. My average pedal force for the 1-minute interstate hill climb on Pate was about 600 lb-in (that's equivalent to alternating 90-lb one-leg squats). That's a lot higher than my typical pedal force of around 450 lb-in.

So the question boils down to this: Can I reduce my cadence when climbing hard and still have the same amount of gas left at the end of a 2 to 4 hour ride. If so, I think I can climb faster with less pain -- and those are both good things.

Friday, May 11, 2007

VO2max and body fat percentage

Yesterday I found a relationship between cycling performance, oxygen transfer, and body fat percentage that I have always missed.

We'll start with oxygen transfer. I think I have a solid understanding of VO2max: it's the maximum amount of oxygen your body can process expressed in milliliters per kilogram of body weight per minute. Below is a detailed description of VO2max. In a later post I'll describe how I plan to use my VO2max testing result (67 ml/kg/min) from yesterday to better structure my bike training.

Variables determining a person's VO2max include lots of body processes and physical characteristics. I'm not formally trained in any of this stuff, I'll probably leave some things out and my info might not be perfect, so take it with a grain of salt, but here are a few of the variables:

  • Lung capacity - every time you breathe air into your lungs, air comes in contact with the interior surface of your lungs, which is flooded with 'used' oxygen-deficient blood that just came from working muscles. The concentration of oxygen is higher in the air than in the blood, so some oxygen diffuses into the blood, which is pumped back to the working muscles. So the area of contact between the air and the blood is important. The greater your lung capacity (volume of air you can inhale), the greater oxygen transfer you get with every breath. An average male can breath about 6 liters of air. Miguel Indurain's lungs can hold 8 liters.
  • Health of lungs - lots of things can damage your lungs. The obvious ones are smoking or working in an asbestos factory, but others such as having pneumonia, getting lots of chest colds, living in a big city, or living downwind of a large coal-fired power plant can also have effects. Lung health deterioration is one of the primary reasons that VO2max is expected to decline by about 0.5 ml/kg/min per year after age 30.
  • Blood volume - the volume of blood in your body doesn't change much with weight changes, but does increase somewhat with extended athletic training. The more blood you have the more oxygen you can move from the lungs to the muscles.
  • Heart capacity - hearts come in different sizes and strengths. I think heart size is mostly genetic, but exercise can strengthen the heart's muscles and allow it to pump more blood. Indurain's heart could pump 50 liters per minute (13 gallons/minute) of blood. For comparison, flow from a typical residential shower head is 2 or 3 gallons per minute, so think of 20 shower heads flowing at once. That's a LOT of blood!
  • Artery size - The bigger the 'pipes' carrying blood from your heart to your muscles, the more blood that can flow and the more oxygen that can catch a ride. I've seen pictures of artery cross sections for untrained average males compared to those of highly trained athletes. The difference is quite dramatic. Arteries in trained athletes can dilate to a much greater size (it seems like I remember that it was more than double) when higher blood flow is required.
  • Capillary density - The more you exercise hard and deprive your muscles of oxygen when they need it, the more your body will respond by growing capillaries to distribute more oxygen in the right places within the muscles. This is one of the primary reasons why athletic training is so sport-specific. A world-class long distance runner might have great lung capacity, heart capacity, and arterial size; but if he hasn't developed high capillary denisty in his cycling muscles, he may be bettered by even moderately-trained cyclists due to their specific training.
  • Cellular efficiency - The efficiency with which your cells convert the oxygen to sugars that your muscles can use to contract is important and can be improved through training. Changes in the number and efficiency of cell mitochondria and the efficiency with which you can buffer lactic acid are two examples.

That's what I knew about oxygen transfer before yesterday. But there is a significant factor related to body weight and body fat percentage that I have always missed or ignored. When analyzing cycling performance, I have always looked at body weight just the way I would look at the weight of the bike - just mass to be pulled up the hill in the gravity equation. I had always assumed that where accelerations and climbing were not a part of the equation (like a long, flat time trial), that body weight was not a real factor in performance except for the relatively small effect it has on body size and increased frontal area/wind friction. My friend Jeff, who won the Georgia state TT jersey for Cat5 last year, is powerful and he's not fat by any definition, but one look at him and you'd know he'd play tackle, not flanker. The fact that he won the TT jersey on a relatively flat course didn't surprise me a bit - it make perfect sense that he could excel in a discipline where I thought his power was important but his weight didn't matter much. But now I realize that there's more to look at in a flat TT than just power production.

What I know now is that blood volume is pretty constant for a given training level. So let's look at this scenario: In the spring I weigh 147 lbs and train 15 hours per week. My body fat percentage is 9.1 percent. I reach a certain fitness level by April and I can average 268 watts for a flat April TT, riding at maybe 23.5 mph. During the summer I maintain the same training regimen, but I add a pint of Chunky Monkey to my diet every other night. By September, I'm still well-trained and fit, and I have the same equipment, but I weigh 160 pounds and have a little excess fat (maybe 14% body fat). I ride the same TT course again, but this time I only produce 245 watts and my speed falls to 22.1 mph. Why did this happen?

It happened because in the fall I have to distribute my blood volume over more body tissue. I have 13 pounds of fat in my body in the fall that wasn't there in the spring (13 pounds is equivalent to 52 sticks of butter). Fat is blood dense, so there is a lot of my blood hanging out in that 13 pounds of fat that can't be used to carry oxygen to my cycling muscles, so I can't generate as much power and I go slower.

The end result is that body weight and body fat percentage has more of an effect on cycling performance than I had previously thought.

Metabolic Testing Results

Cycling is a great sport. It's healthy, it's social, and it can be extremely competitive. It gives me a free pass to eat good food and drink great wine. And if group rides are any indication, I can hope to maintain fitness and strength in cycling for several decades to come. But that's enough waxing poetic, now for the numbers.

A lot of the enjoyment I get from cycling is from being a lab rat in the science experiment of training. About 17 months ago, when I was first considering switching from triathlon to full-time cycling, I decided I'd get tested for some basic metabolic benchmarks. It was December 2005, I'd been training with some sort of structure for about 5 years, and the numbers looked something like this:

December 2005
Predicted max heartrate: 182 bpm
Lactate threshold (LT): 135 bpm (heartrate where sugar burning takes over as energy)
Aerobic threshold (AeT): 116 bpm (heartrate where I first start burning fat)
VO2max: 64 ml/kg/min (ability to uptake and use oxygen)
Body fat percentage: 10.4%

Yesterday I had the numbers run again to find out how they've changed after a year and a half of more intense cycling-specific training.

May 2007
Predicted max heartrate: 182 bpm
LT: 145 bpm
AeT: 127 bpm
VO2max: 67, but hit 70+ for short period in test
Body fat percentage: 9.1%

Over the next few posts, I'll take a look at each of the results and their implications to my training and racing (and eating). Also, I learned a few new things about exercise physiology from Tony Myers at ATS that I found interesting, so I'll elaborate on those as well.

Saturday, April 14, 2007

Power profiling

As Andrew Coggan states in his introduction to power profiling, It's human nature to want to know how you compare to others in your sport. He developed a chart that relates racing category with power-to-weight ratio for 5-second, 1-minute, 5-minute, and FTP (1 hour) intervals. It's interesting to see where my numbers fall on the chart. I don't have accurate numbers for the 1-minute duration because I haven't tested for that time interval, but I will soon. I was pleased to see that my FTP and 5-minute power to weight ratios are good; however, it's clear that I need a lot of work on my sprinting (5 sec and 1 min).

The chart depicts in red my power-to-weight ratios. The upward slope to the right indicates a typical time trialist profile. (Based on the other numbers, I'm guessing my 1-minute number will be in the 7.2 or 7.3 watts/kg range.) A good all around racer would have a flatter profile. A sprinter's profile would slope downward from left to right. Some of it is dictated by genetics (fast twitch vs. slow twitch muscle fiber percentages). But I think I could flatten my curve quite a bit with proper training.

Click the chart to see it better.

April FTP Test results

First, there's a lot more to successful racing than power output. Second, there's a lot more to measuring power output than just functional threshold power (FTP), or 1-hour average power. The ability to generate a high power in sprints and breaks is crucial for successful racing. Nevertheless, I've found that FTP is a good benchmark to measure my current fitness and see how my training is progressing, and I plan to run 1-hour FTP tests in December, April, and August.

Last August, my FTP was 220 watts. My December test improved the number to 238 watts. But today's April test showed that my FTP is now 268 watts, a 13% improvement over the past 4 months, or 7.5 watts per month.

I knew that my fitness had improved because my hill repeat interval times have plummeted of late, and I've been getting IF numbers greater than 1.00 on hard training rides, which should not happen except maybe for very short intense interval sessions. But I didn't expect my FTP to be that high. It's nice to know that hard training works sometimes.

In calculating my FTP, I looked at three numbers. First, my unadjusted average power for 60 minutes was 263 watts. Based on my experience and research, I multiply the raw average by 1.02 to 'convert' training to racing power and account for the racing motivation factor. 263 x 1.02 = 268 watts. The second way I estimate FTP is by looking at unadjusted normalized power, which was 267 watts. Lastly, I take 95% of my maximum average power for a 20-minute time trial. My highest recent 20-minute average is 283 watts. 283 x 0.95= 269 watts. The three methods only differ by 3 watts, which is amazing considering my Ergomo power meter's advertised accuracy is only about 2-3%, I think, which would be 5-10 watts.