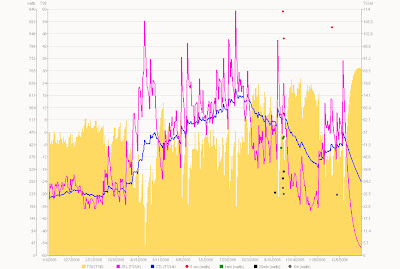
Cycling Peaks software has a new feature developed by Dr. Coggan that's pretty interesting. Finding good cycling form has always been more art than science, and maybe it still is, but his Performance Manager, which was incorporated into the last update of Cycling Peaks WKO+ makes an effort to determine form scientifically if you load the power data file for every single workout that you do into the software. Here are the basics:
1. For each ride, the software computes your Normalized Power (NP), which is the steady power equivalent of the entire workout. This number, which is usually higher than your average power is calculated using a rolling 30-second average and some fourth-power polynomials to approximate your body's response to irregular power output.
2. Your intensity factor (IF) is just NP/FTP (Your Functional Threshold Power [FTP] is your steady 1-hour TT max power). An intensity factor of 0.7 means your average effort was about 70% of threshold.
3. The software computes a Total Stress Score (TSS) for each workout. TSS is (time in hours)*(IF^2)*100. So an easy one and a half hour ride might be TSS=(1.5)*(0.7*0.7)*100=73.5.
4. Performance manager defines your Acute Training Load (ATL) as the average TSS per day over the past 14 days, and it defines your Chronic Training Load (CTL) as your average TSS per day over the past 6 weeks.
5. Finally, Total Stress Balance (TSB) is designed to represent your cycling form on any given day. It is calculated: TSS=ATL-CTL. Theoretically, the higher your TSB, the better your form, and you'll normally feel strongest when your TSB is a positive number.
See my recent Performance Manager chart below, and my 2005 chart below that. The red line is ATL, the blue line is CTL, and the yellow bars are TSB. Click on the charts to get a legible version.
November 5, 2006 to present:
January 1, 2005 to current:


0 Comments:
Post a Comment