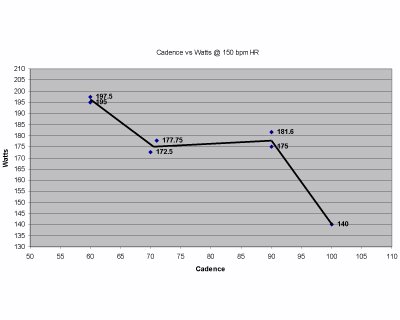
After running cadence vs. power at four different cadenses and then performing confirmation tests on three of them, this is what my cadence vs. power graph looks like:
On the three points that have confirmation data (cadences 60, 70, and 90 rpm) the higher of the two was my second test. An extra couple of weeks fo training might explain the slightly higher numbers. Or maybe I'm just getting more accustomed to a lower cadence, which felt very unusual at first, but feels comfortable now. All the tests were run at a constant heartrate of 150 bpm, which is about 10 bmp above my lactate threshold.
My next step will be to run tests at 55 rpm and 65 rpm to generate more detailed information in the vicinity where my apparent peak lies (I'm guessing 55-60 rpm). After I determine the exact peak, then I'll have to do some real-world tests to see if that cadence is maintanable. It should work well for time trials of 20 to 45 minutes, but might not be great for group rides.
February 8, 2014
11 years ago


0 Comments:
Post a Comment