If you don't like numbers and charts, now's your chance to hit the back button. Click charts to enlarge.
It's obvious that the use of power measurement for training is relatively new to all except pro and olympic athletes. Lots of folks are looking for the most useful ways to analyze at their data in Cycling Peaks. Specifically, I've had several folks have ask about my recent Performance Manager and mean maximal power data. I'm still learning how to use the data and to find the best ways to benefit from it in training and racing, but I've pasted some charts below with rough descriptions.
This is my Performance Manager data from May 1, 2006 through May 1, 2007. One of the most significant things I can draw from this chart is to see that I was virtually untrained (chronic trainin load = 24 TSS/d) this same time last year. My current CTL, 75 TSS/d, is higher now than my peak TSS for all of last year, which occurred in early August. That's either great news or it means I'm in for a really stale summer.
 This is my performance manager chart for this season (since November). It's just a blow-up of the 1st chart, but has my 5 best power outputs for various time intervals superimposed onto it. It's worth noting that I've set most of my 1-min, 5-min, 20-min, bests in April and had a big spring up-tick in the 1-hr (I only test that every 4 months).
 These are my weekly bests for each time interval for the season. I obviously had an easy week in early February. All the lines are pretty flat until late February. That's when I started doing more intensity work. I've made good progress in the 25-second to 5-minute range, but the sprint power seems stuck in neutral - an indicator that I either need to modify my training or get new parents.
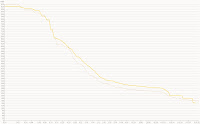
 This is a mean maximal power plot comparing November through February with March and April. The yellow line is March-April. As indicated in some of the other charts, the change is minimal up through about 15 seconds, but significant progress shows up in longer time intervals. From 30sec to 1hr, I've gained 30 to 50 watts.
 Lastly, this is my mean maximal normalized power comparing the same periods as the previous chart. Normalized power isn't calculated for efforts under 5 minutes. Good progress across the board here except I'm not doing 2-3 hour harder rides now like I was this winter in the Peach Peloton.


0 Comments:
Post a Comment