
I've attached some of my power training data. I find it useful for measuring progress from year to year and for training motivation, but also to see where the weak spots are in my training and/or ability.
This is my mean maximal power graph. (click on the graphs to see them better). It shows the maximum power I can hold for any given time interval. The time graph is logorithmic, the yellow line is this season, and the dashed line is last year. It's not really a valid graph because all of last year's data came from the computrainer and this year has road data and CT data. The 2007 power graph is significantly higher than the 2006 graph for most time intervals. But the two lines are the same for the interval from about 15 seconds to about 30 seconds. Since all of my 2006 data is from training sessions on the computrainer, it probably means I did high intensity 15-30s intervals last year on the CT and either haven't done intervals in that range this year or have not improved my power in that range. It would be interesting to know which is the case, so I'll schedule some hard 20-30 second intervals this week to find out.
This is the same data, but it reflects normalized power (equivalent constant power output instead of average power). Normalized power isn't valid for short intervals, so this graph starts at about 5 minutes. I see clear improvement since last year, but the real test will be comparing 2007 data with 2008 data.
 This is the most comprehensive chart. It's my performance manager chart, which reflects acute training load (ATL), chronic training load (CTL), total stress balance (TSB), and my best wattage outputs for certain time intervals.
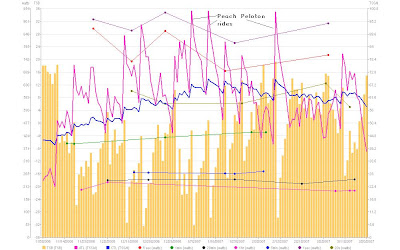 The blue line (CTL) is the one I watch the most. It tells me my training load for the past 6 weeks. The yellow bars represent my TSB. I'd be expected to perform well when it's above 0, near +10. I can tell by the absence of any 1-minute (green) data lately that I need to do some 1-minute intervals to check my progress there. It's obvious that I need to increase my stress during the week to prevent decay of the CTL. My plan is to peak at 75 or 80 CTL in June and again in September.


0 Comments:
Post a Comment